archive
NFT Adoption Rate by Countries
Who doesn’t know the term NFT? Following the growth of the non-fungible digital art, as proven by the $10B+ market cap, NFTs are starting to become a mainstream collectible asset. It all began with one CryptoPunk developed by Larva Labs. This article will cover thoroughly on the NFT adoption rate, be it by countries or any metrics.
Based on research held by Statista (published in Jan 20, 2022), the NFT euphoria began when Beeple’s prominent crypto art “First 5000 Days” became the world’s most expensive NFT valuing at $69M USD. Thereafter, the NFT market started to branch into wide different sectors: collectible, artwork, event tickets, music and media, gaming, big sports moment, trading cards, virtual fashion, real world assets, domain names, memes, and much more! The research’s results indicate that the NFT sector with highest value of sales are digital collectibles (i.e. baseball trading cards or digital art). Complementing this, the NFT sector with the highest number of sales is achieved by the gaming sector (i.e. skins, stats, attribute, etc). These NFT statistics result in a 138.7% growth YoY by market cap.
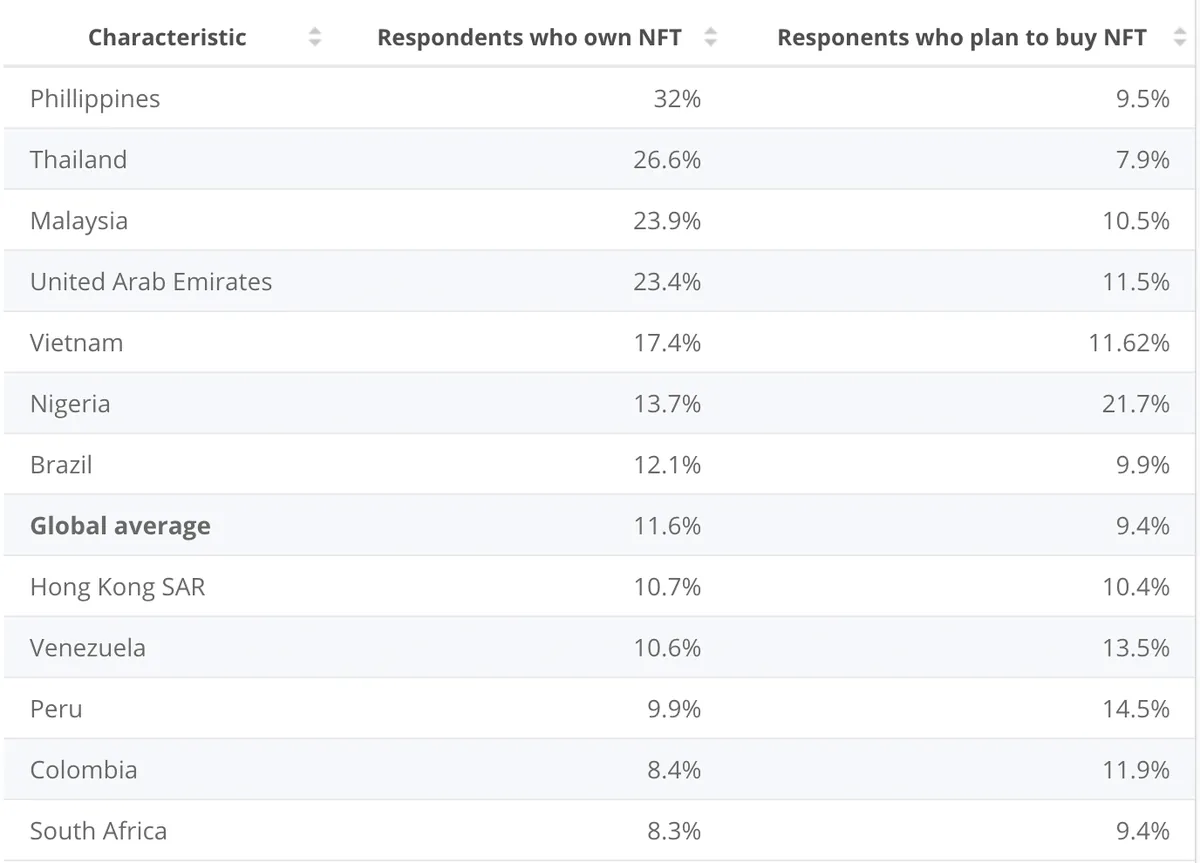
Another survey from Statista (published on Jan 20, 2022). Most of the respondents from well-developed countries, such as the US, UK, Canada, and Germany, were less likely to buy or have NFTs in 2021 compared to other adults in the world. The results indicate that NFTs are especially popular in Southeast Asia and Latin America. Do note, however, that the ranking of a certain country might drastically change given a period of time, since most governments could either sanctions or tax NFT at any time.
 ’
’
NFT Adoption by Countries (Statista.com)
A survey from civicscience indicates that most of the people who buy NFTs are from a young age (18 to 24) and continue decreasing as the age increases. 15% of the young adults have invested in NFT while the other 18% are interested and the other 69% are not interested.
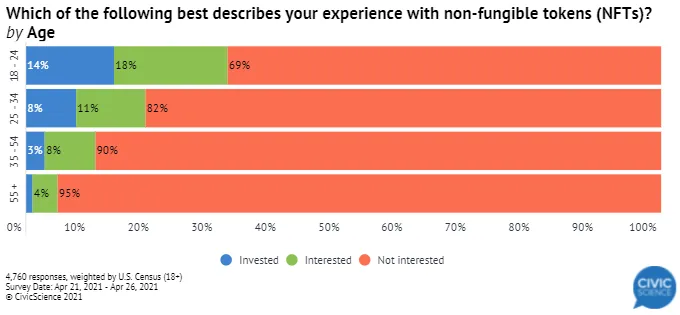
Age Demographic Distribution of NFT Buyers (civicscience.com)
Another result from the survey shows that most of the buyers from NFT are from people that have an income of less than $25,000. Interestingly enough, the survey also pinpoints that the number of buyers from people with more than $150,000 income is also the same as the former.
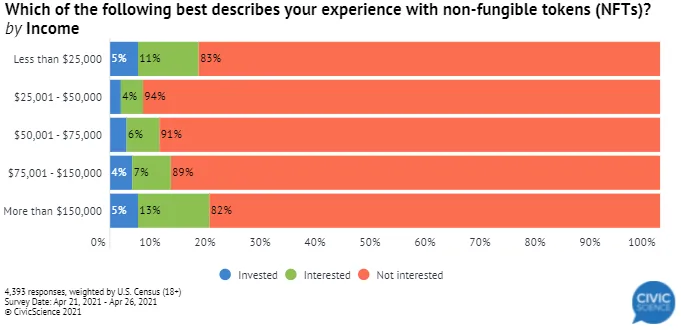
Income Demographic Distribution of NFT Buyers (civicscience.com)
These age and income correlation begs the question: why do people actually buy or invest in NFTs?
To address this question, There are several types of NFT buyers: Flippers, Collectors, Early Adopters, Early Mainstream, and Big Brands. Though there are no statistics currently, it would be really beneficial to see the distribution of the types of buyer in the NFT market. That said, the income demographic from civic science indicates that most of the high net worth buyers are NFT flippers – capitalizing from short-term momentum hype gains. Most of the collectors are social media personalities – Gary Vee, Jay-Z, Mark Cuban.
Though these statistics may indicate that NFT has a potential to be on par with world-class assets, it should be known also that not all countries have a view in the same manner. As of 2021, according to the Law Library of Congress report, over 50 countries (i.e. Egypt, Iraq, Qatar, Oman, Morocco, Algeria, Tunisia, Bangladesh, China, etc) have bans on cryptocurrency and/or have taken the step of banning crypto either implicitly or absolutely. This implies that these countries have a harder time obtaining an NFT given that the gas price or value of NFT is determined by their native cryptocurrency tokens.
Diving further deeper into the statistics based on country, the Sample Penetration Rate could be taken from the Statista’s data. Sample Penetration Rate follows the equation: $Sample\ Number\ of\ People\ Adopting\ x\ /\ Total\ Number\ of\ Population$. The following data are the top 3 countries with highest NFT ownerships. The Philippines with a sample of 2,050 NFT owners have a penetration rate of 0.001846%, Thailand has a penetration rate of 0.00243%, and Malaysia has a penetration rate of 0.004654%. Comparing these country-specific penetration rates, the global penetration rate is 0.0035443% (number of unique addresses, owners, is taken from statista).
Another interesting statistic is the relationship between NFT awareness and ownership globally. The data is taken from finder.com.
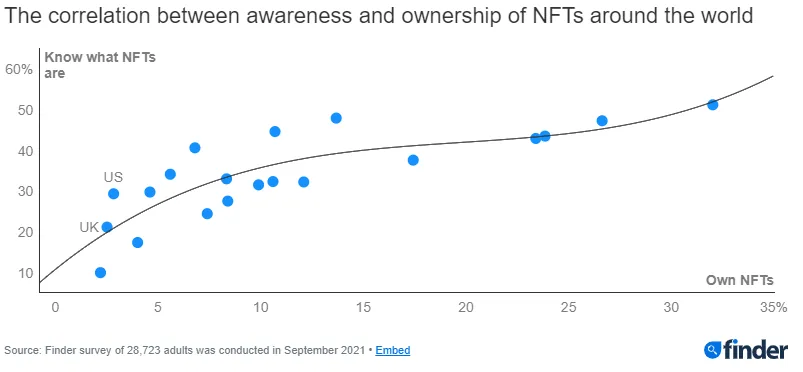
Correlation Between NFT Awareness and Ownership (finder.com)
The chart above indicates that NFT ownership has a strong correlation with NFT awareness. Actively indicating that ownership will increase as people become more aware of what NFT is. The top 5 countries with adults not knowing what an NFT is are Japan (90%), Germany (82.6%), United Kingdom (78.8%), Argentina (75.5%), Colombia (72.4%).
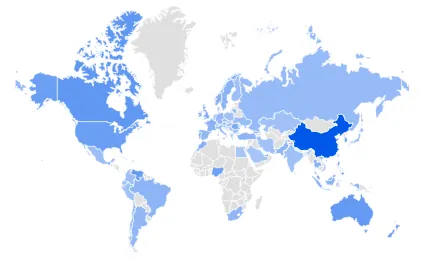
Another metric to determine potential NFT adoption over time by country is from Google Search Trends. The general trend illustrates that the term NFT has a steady rising trend with a plummet lately. The most searched terms came from Asia: China, Singapore, Hong Kong, Philippines, and Taiwan.
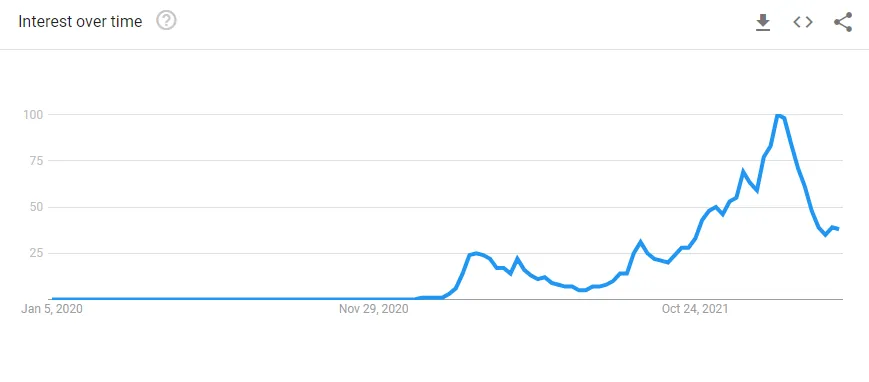
Google Search Trend “NFT” (data from Jan 5, 2020 to Mar 24, 2022)